Production Possibilities Graph
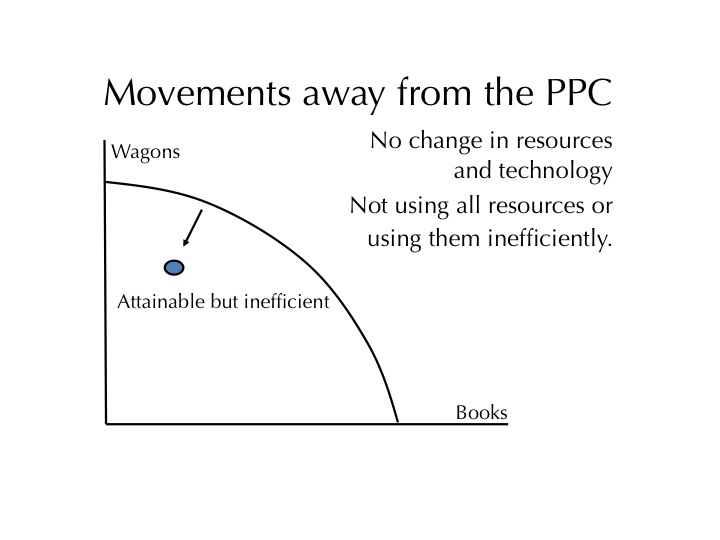
It shows alternative ways to use an economy's resources. The line on the PPG is known as the frontier or curve. When producing at the frontier efficiency occurs. When producing beneath the frontier underutilization occurs.
Efficiency- means using all resources in such a way to maximize the production of goods and services. In essence, Efficiency increases profit.
Underutilization- it is the opposite of efficiency. It is using fewer resources than in the economy is capable of using. It leads to a decrease in profit.
Point A - attainable, inefficient (inside the curve), underutilization due to unemployment or underemployment. Links to recession & famine
Ex: A McDonald's Donald's store that has few staff members to serve a school sports team and staff after a game. attainable & efficient ( on the curve )
Ex: A McDonald's Donald's store that has few staff members to serve a school sports team and staff after a game. attainable & efficient ( on the curve )
Point B - attainable & efficient ( on the curve )
Point C - unattainable using the current resources ( outside the curve )
Ex: Technology.
4 Key Assumptions
1. Only 2 goods can be produced
2. Full- employment of resources
3. Fixed resources ( factors of production )
4. Fixed technology
2. Full- employment of resources
3. Fixed resources ( factors of production )
4. Fixed technology
Three types of movements that occur within the PPC
- Along the PPC
 |
| The arrow also goes to the other direction |
For deeper understandment:
Curve(PPC)
Frontier( PPF)
Types of Efficiency
Productive Efficiency
- Products are being produced in the least costly way.
- This is any point ON the Production Possibilities Curve.
Allocative Efficiency
- The product being produced are the ones most desired by society.
- This optimal point on the PPC depends on the desires of society.

