Thursday, October 17, 2019

Production Possibilities Graph (01/05 /17)


Production Possibilities Graph
It shows alternative ways to use an economy's resources. The line on the PPG is known as the frontier or curve. When producing at the frontier efficiency occurs. When producing beneath the frontier underutilization occurs.
Efficiency- means using all resources in such a way to maximize the production of goods and services. In essence, Efficiency increases profit.
Underutilization- it is the opposite of efficiency. It is using fewer resources than in the economy is capable of using. It leads to a decrease in profit.


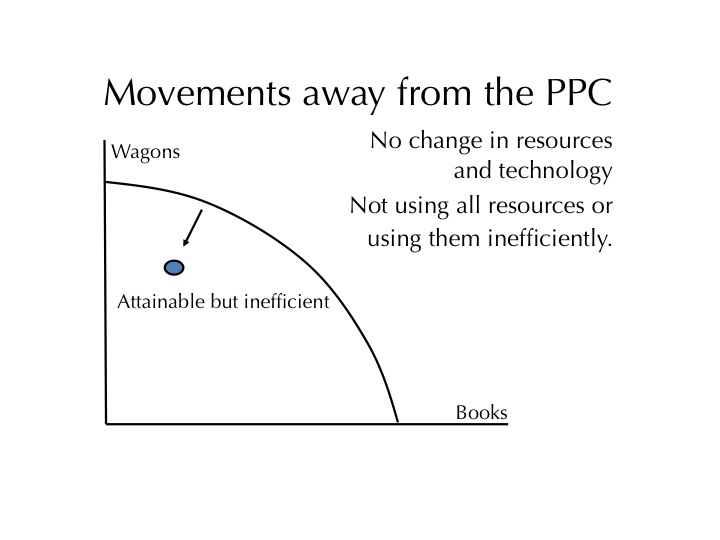
Point A - attainable, inefficient (inside the curve), underutilization due to unemployment or underemployment. Links to recession & famine
Ex: A McDonald's Donald's store that has few staff members to serve a school sports team and staff after a game. attainable & efficient ( on the curve )
Point B - attainable & efficient ( on the curve )

Point C - unattainable using the current resources ( outside the curve )
Ex: Technology.

4 Key Assumptions

1. Only 2 goods can be produced
2. Full- employment of resources
3. Fixed resources ( factors of production )
4. Fixed technology


Three types of movements that occur within the PPC
  • Inside the PPC Image result for 3 types of movement in ppc
  • Along the PPC 

    The arrow also goes to the other direction

    • Shifts of the PPC
    Image result for shifts of the ppc


    For deeper understandment:

    Production Possibilities Graph (PPG)
                                               Curve(PPC)
                                           Frontier( PPF)


    Types of Efficiency

    Productive Efficiency
    • Products are being produced in the least costly way.
    • This is any point ON the Production Possibilities Curve.

    Allocative Efficiency
    • The product being produced are the ones most desired by society.
    • This optimal point on the PPC depends on the desires of society.

    Thursday, May 18, 2017

    Comparative & Absolute Advantage (05/11/17)


    Specialization
    • Individuals and countries can be better off if the will produce in what they have a comparative advantage and then trade with others for whatever else they want/need
    Absolute and Comparative Advantage

    Absolute Advantage 
    • The producer that can produce the most output OR requires the least amount of inputs (resources) 
    • Ex: Papa John has an absolute advantage in pizzas because he can produce 100 and Ronald can only make 20. 
    Comparative Advantage 


    • The producer with the lowest opportunity cost. 
    • Ex: Ronald has a comparative advantage in burgers because he has a lowest PER UNIT opportunity cost. 
    Countries should trade if they have a relatively lower opportunity cost.
    They should specialize in the good that is "cheaper" for them to produce


    Distinguishing input from output problems

    Example of an output problem
    • An Output problem presents the data as products produced given a set of resources. (ex. Number of pens produced)
    • An Input problem presents the data as amount of resources needed to produce a fixed amount of output. (ex. Number of labor hours to produce 1 bushel)
    • When identifying absolute advantage, input problems change the scenario from who can produce the most to who can produce a given product with the least amount of resources

    Unit 7 - Foreign Exchange (FOREX) (05/10/17)


    Foreign Exchange (FOREX)


    • The buying and selling of currency
    - Ex. In order to purchase souvenirs in France, it is first necessary for Americans to sell their Dollars and buy Euros.
    • Any transaction that occurs in the Balance of Payments necessitates foreign exchange
    • The exchange rate (e) is determined in the foreign currency markets. 
    Changes in Exchange Rates 


    • Exchange rates (e) are a function of the supply and demand for currency. – An increase in the supply of a currency will decrease the exchange rate of a currency
    Exchange Rates determinants


    • Consumer Tastes
    • Relative Income 
    • Relative Price Level
    • Speculation 
    Exports and Imports
    • Appreciation of the dollar causes American goods to be relatively more expensive and foreign goods to be relatively cheaper thus reducing exports and increasing imports 
    • Depreciation of the dollar causes American goods to be relatively cheaper and foreign goods to be relatively more expensive thus increasing exports and reducing imports 


    Unit 7- Balance of Payments (05/08/17)


    Balance of Payments


    • Measure of money inflows and outflows between the United States and the Rest of the World (ROW)
    - Inflows are referred to as CREDITS
    - Outflows are referred to as DEBITS
    • The Balance of Payments is divided into 3 accounts:
    - Current Account
    - Capital/Financial Account
    - Official Reserves Account

    Current Account


      Balance of Trade or Net Exports
      • Exports of Goods/Services – Import of Goods/Services
      • Exports create a credit to the balance of payments
      • Imports create a debit to the balance of payments
      Net Foreign Income
      • Income earned by U.S. owned foreign assets  – Income paid to foreign held U.S. assets.
      - Ex. Interest payments on U.S. owned Brazilian bonds – Interest payments on German owned U.S. Treasury bonds or a pension payment to an American retiree living in the Bahamas.
      Net Transfers (tend to be unilateral)
      • Foreign Aid → a debit to the current account
      - Ex. Mexican migrant workers send money to family in Mexico (remittances)
      Capital/Financial Account


        • The balance of capital ownership
        • Includes the purchase of both real and financial assets
        • Direct investment in the United States is a credit to the capital account
        - Ex. The Toyota Factory in San Antonio
        • Direct investment by U.S. firms/individuals in a foreign country are debits to the capital account
        - Ex. The Intel Factory in San Jose, Costa Rica
            • Purchase of foreign financial assets represents a debit to the capital account.
            - Ex. Warren Buffet buys stock in Petrochina.

            • Purchase of domestic financial assets by foreigners represents a credit to the capital account. 
            • The United Arab Emirates sovereign wealth fund purchases a large stake in NASDAQ.
            Relationship between Current and Capital Account

            • The Current Account and the Capital Account should zero each other out.
            • That is… If the Current Account has a negative balance (deficit), then the Capital Account should then have a positive balance (surplus).
            Official Reserves

            • The foreign currency holdings of the United States Federal Reserve System.
            • When there is a balance of payments surplus the Fed accumulates foreign currency and debits the balance of payments.
            • When there is a balance of payments deficit the Fed depletes its reserves of foreign currency and credits the balance of payments
            • The Official Reserves zero out the balance of payments.


            Monday, April 24, 2017

            Unit 5 - Reaganomics, Laffer Curve (04/24/17)


            Supply-side economics or Reagonomics


            • Stimulate production or supply to spear output
            • They cut taxes and government regulation, to increase incentive for business and individuals
            • Business invest and expand creating jobs

            • People work, save, and spend money
            Laffer Curve

            It depicts a theoretical relationship between tax rates and tax revenues.
            • The lower the taxes the more the government is able to collect in taxes

            Criticism of the Laffer Curve

            1.  Empirical evidence suggest suggest that the impact of tax rates on incentives to work, save, and invest are small
            2.  Tax cuts also increase demand which can fuel inflation and demand impacts may exceed supply impacts
            3.  Where the economy is actually located on the Laffer Curve is difficult to determine

            Sunday, April 23, 2017

            Unit 5 - Laffer Curve (04/20/17)


            Laffer Curve

            Inflation- it is a rise in the general level of prices.


            Deflation- it is a general decline in the economy price level.


            Disinflation- it is a reduction  in the inflation rate from year to year.

            Hyperinflation- it is a rapid rise in the price level, basically an extremely high rate of inflation.

            For better understanding watch:

            Unit 5 - Phillips Curve (04/19/17)


            Phillips Curve


            It is in inverse relationship between unemployment and inflation. Basically a trade-off , as one increases the other decreases.

            • In increae in AD will cause price level and real output to increase, which increases inflation and reduces unemployment.


            •  Each point point on the Phillips Curve corresponds to a different level of output.

            • Since wages are sticky, inflation changes move the point in SRPC, if inflation persists and expected rate of inflation rises, than the entire SRPC moves upward. In the event that this scenario happens you have stagflation.

            • Stagflation, unemployment, and inflation rise simultaneously, wich results in an increase in output cost. In in event that this scenario occurs the Phillips Curve is going to shift outward.

            Supply shock- sudden large increse in resource cost.


            If inflation expectations drop due tonew technology or efficiency then the SRPC will move downward.


            • In the long run LRPC occurs in the natural rate of umenployment

            • It is represented by a vertical line.

            • There is no trade-offf between unemployment and inflation in the long run, because the economy produces at the full employment output level.

            • It will only shift if the LRAS

            • Increase in Un will shift LRAS→

            • Decrease in Un will shift LRAS ←
            The major LRPC assumption is that more workers benifits create higher natural rates, and fewer workrs benifits create lower natural rates.

            Misery Index - it is a combination of unemployment and inflation in any given year. 
            • Single digit misery is good